When an industrial customer calls and says, “I need 2 500 m³ h⁻¹ of oxygen cleaned to 99.9 % through a 50 µm bronze filter— operating at 42 bar, 45 °C, and with a velocity limit of 0.20 m s⁻¹—can you help?” the answer is rarely a simple yes or no. It is the beginning of a technical detective story in which every assumption must be interrogated, every unit double-checked, and every design decision justified. This post tells that story: how a single mis-typed digit nearly steered a project off course, how the difference between standard-volume and actual-volume flow became the central plot twist, and how a final design built around sixteen parallel sintered bronze caps emerged as the right answer. If you have ever wrestled with high-pressure gas filtration, read on—you will find hard numbers, practical equations, and, above all, a blueprint for turning client confusion into engineering clarity.
Act I – The First Inquiry
Our customer’s e-mail looked straightforward:
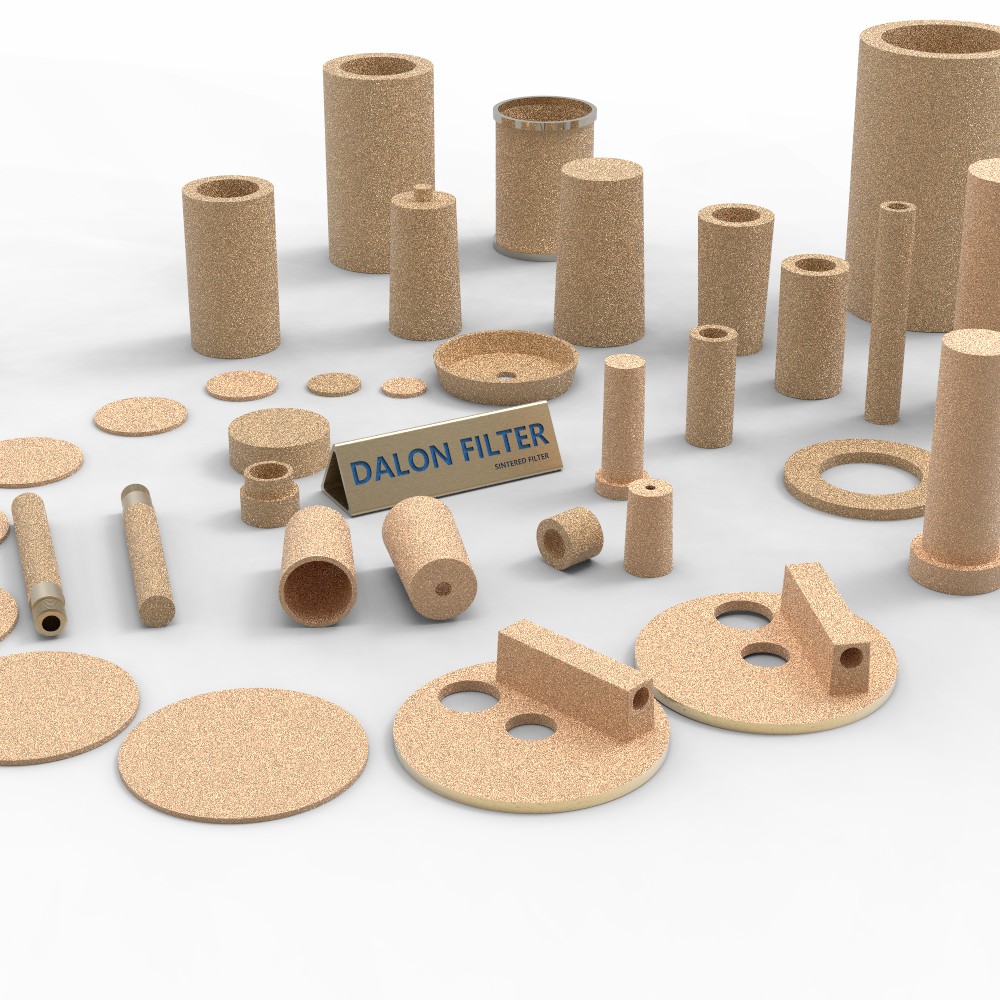
Filter medium: sintered bronze, 50 µm
Gas: oxygen
Flow rate: 2 500 m³ h⁻¹
Operating pressure: 42 bar(g)
Differential pressure limits: 0.20 bar clean, 0.50 bar dirty
Temperature: 45 °C
Velocity limit: 0.20 m s⁻¹
Element envelope: closed-end cap, 130 mm OD, 120 mm ID, 500 mm long
From experience, the wall thickness (5 mm) and total porous area (~0.217 m²) suggested good permeability, but the flow looked aggressive. Using the superficial velocity formula,
V_s = Q / A_eff
we plugged in the numbers and obtained a sobering 3.2 m s⁻¹—sixteen times the client’s limit. Something was off. We went back to the customer.
Act II – The Mystery of the Missing “n”
The first clue surfaced when we asked a simple question: “Is the 2 500 m³ h⁻¹ given at standard conditions (1 bar, 15 °C) or at your actual 42 bar operating pressure?” The answer came back—after a short pause—as “standard, of course”. That single word flipped the calculation.
Using the ideal-gas law, we converted standard volume to operating volume:
Q_oper = Q_std × (P_std / P_oper) × (T_oper / T_std)
Substituting 1 bar/43 bar and 318 K/288 K, 2 500 m³ h⁻¹ shrank to 64 m³ h⁻¹— a forty-fold reduction. Rechecking the velocity:
V_s = 0.018 m³ s⁻¹ / 0.217 m² ≈ 0.09 m s⁻¹
and the pressure drop (Ergun correlation) landed at a reassuring 0.03 bar. One 130 × 500 mm cap could easily meet the duty. We drafted the success e-mail, ready to quote tooling.
Act III – A Typo, a Twist, and a Test of Calm
Just before hitting send, the client slipped in a casual postscript: “If the filter is designed to have a velocity of 2 m s⁻¹ at 42 bar, how many pieces do we need?” It contradicted the 0.20 m s⁻¹ limit and hinted that the flow figure might actually be actual volume after all. We resisted the urge to panic and instead replied with both scenarios:
-
At 2 m s⁻¹, still assuming 2 500 m³ h⁻¹ @ 42 bar, only two caps were sufficient.
-
At 0.20 m s⁻¹, the same flow demanded sixteen caps.
The next morning the customer apologised: “I’m sorry about my mistyping. The gas velocity is 0.2 m s at 42 bar.” Confirmation at last—actual flow, actual pressure, actual velocity limit.
Act IV – Crunching the Definitive Numbers
Now we could solve the puzzle unambiguously.
-
Operating flow:Q_oper = 2 500 m³ h⁻¹ = 0.694 m³ s⁻¹
- Porous area per cap:
- A_side = π × 0.13 m × 0.50 m ≈ 0.204 m² (Side wall)
- A_end = π × (0.065 m)² ≈ 0.013 m² (Closed End)
- A_cap = 0.217 m² (Total)
- Velocity with one cap :V_s,1 = 0.694 m³ s⁻¹ / 0.217 m² ≈ 3.2 m s⁻¹
- Required number of caps : n = V_s,1 / V_limit = 3.2 / 0.20 ≈ 16
Result: Sixteen identical caps in parallel.
We also checked the pressure drop: at 0.20 m s⁻¹ the Ergun equation predicted 0.03–0.04 bar, leaving plenty of margin before the 0.20 bar clean limit.
Act V – Designing the Parallel Bank
Numbers alone do not mount on a skid. We next turned to practical layout. The easiest path was two symmetrical manifolds of eight caps each, fed by a 2-inch schedule-160 header rated to 50 bar. Such a split not only balanced the load but fit through the client’s workshop doorway. Each cap would have its own ½-inch isolation valve for maintenance without full shutdown.
To minimise header losses we modelled flow with a CFD plug-in— a step few suppliers bother with but one that uncovered a slight recirculation pocket near the end cap. Adding a tapered diffuser solved it, ensuring even distribution.
Act VI – Material, Safety, and Testing
Bronze is benign in air, but pure oxygen at 42 bar can ignite lesser metals. We moved to ASTM C-613 Class 20 bronze and specified a degreasing procedure compliant with ASTM G-93 Level C before final bagging. Burst strength exceeded 200 bar per ISO 4022; creep testing at 60 °C under 60 bar gave a lifetime in excess of 20 000 h.
Finally, because theoretical pressure drop is only as good as the data behind it, we offered a witness test: one production cap mounted in our lab rig, flowing oxygen from 0 to 0.25 m³ s⁻¹ at 45 °C and logging ΔP in real time. The curve matched the model within ±8 %.
Act VII – Signing Off and Shipping Out
With calculations verified, drawings approved, and a delivery schedule agreed, the order for sixteen caps plus manifolds was placed. The story ends not with a signature but with an installation: sixteen bronze cylinders standing in two tidy rows, quietly scrubbing oxygen day after day while operators read a differential gauge stuck at 0.04 bar. The client’s production line never skipped a beat.
Lessons for Every Filtration Engineer
1. Flow basis first, always. Ask “standard or actual” before you open your calculator. A forty-fold error hides in that distinction.
2. Demand clarity on velocity limits. A single missing zero (0.2 m s⁻¹ vs 2 m s⁻¹) can flip a design from single piece to multi-element.
3. Use conservative correlations. The Ergun equation is not perfect for sintered media, but with correct porosity and wall thickness it gives reliable first-pass estimates of ΔP.
4. Remember manifolds matter. Even-flow distribution is as critical as element sizing; CFD or at least a careful momentum balance pays off.
5. Cleanliness is king in oxygen service. Select alloy, specify degreasing, and lock in a burst-pressure test to keep safety auditors happy.
6. Offer proof. A real flow/pressure-drop curve builds trust faster than a spreadsheet screenshot.
Epilogue – From Numbers to Narrative
In technical sales we often race to the quote, eager to proclaim “yes, we can”. Yet the best solutions emerge when we slow down and turn uncertainty into structured conversation. This project reminds us that engineering is dialogue— a back-and-forth through which assumptions become facts, and facts become hardware. The next time a customer e-mails a seemingly impossible specification, remember the oxygen filter at 42 bar: a story that began with a typo and ended with sixteen perfectly balanced bronze caps humming in unison.